Introduction
The goal of CroptimizR is to provide facilities for performing parameter estimation of crop models from observations of their simulated variables.
This article presents the main concepts and features of the package.
Concepts
Parameter estimation
Parameters of Crop Models are sometimes difficult or impossible to measure with experiments or to set from bibliography. In that case, their values are often adjusted by comparing the resulting simulated model outputs to a set of corresponding observed values measured on experimental fields. This process is often called model calibration. Several studies have shown that the way calibration is performed largely impact crop model simulation results (see e.g. Confalonieri et al., 2016; Guillaume et al., 2011; He et al., 2017; Wallach et al., 2021a; Wallach et al., 2021b, Wallach et al., 2022).
Mathematical parameter estimation techniques are particularly useful in this case since they can automatically explore the potential values of several parameters and take into account observations of several variables. They typically consists in finding the parameters values which minimize a distance between the results of model simulations and the corresponding observations.
Specific features and interest of CroptimizR
A lot of packages propose implementations of parameter estimation methods. None of them are however particularly adapted to crop models and they do not share a standard format for coupling models to the methods they implements. As a result, crop models users may be lost in the multiplicity of packages and methods proposed and must provide a significant effort to test different packages.
The objective of CroptimizR is to provide ad hoc tools and methods to calibrate crop models from observations of their simulated variables and to easily compare different types of methods on different crop models.
For that, it offers a generic framework for linking crop models with up-to-date and ad-hoc parameter estimation algorithms implemented in external packages. It proposes a standard interface for crop models, a set of adapted calibration procedures and goodness-of-fit criteria as well as additional specific features.
In particular, calibration protocols defined in the AgMIP Calibration project are implemented in CroptimizR (see this example illustrating the use of CroptimizR to apply the AgMIP calibration protocol on a complex crop model).
CroptimizR has actually been used with more than a dozen crop models in AgMIP calibration exercises (see, e.g., Wallach et al., 2023, 2024, 2025).
Other advanced features include among others:
- Automatic parameter selection algorithm,
- automation of sequential multi-step parameter estimation
workflows,
- fine tuning of the selected optimization algorithm through specific options,
- specification of initial values and constraints on the estimated
parameters (bounds and/or freely-defined constraints such as
equalities/inequalities between parameters),
- dynamic execution of user-defined transformations for observed
and/or simulated values of model output variables in case they would not
be directly comparable,
- forcing of crop model parameters to given values while estimating
others,
- modulating the level of additional information in output of the
parameter estimation process (from nothing to all simulated results for
each parameter values tested),
- …
More details about the list of available methods and goodness-of-fit criteria can be found here.
Principle of use
Basically, to use CroptimizR on their own case, users must provide:
- an R wrapper function for the crop model to use and the associated options,
- a list of observed values of model output variables,
- a list of parameters to estimate.
The parameter estimation process automatically runs the given crop model on a set of observed situations by forcing the estimated parameters to the values proposed by the selected algorithm. It will then compute the selected goodness-of-fit criterion using the simulated values and corresponding observations of the model output variables (see Figure 1).
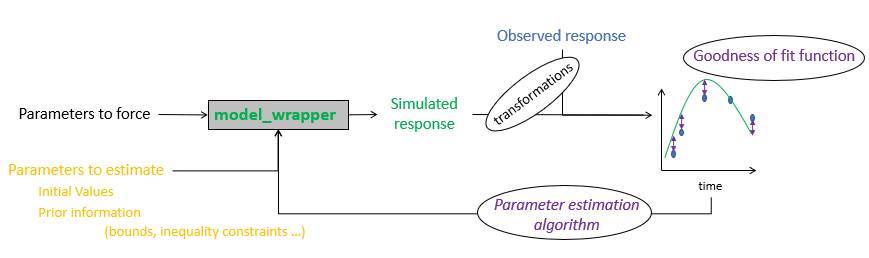
Figure 1: Schematic representation of the parameter estimation process.
In output, CroptimizR generates specific statistics and graphs depending on the family of the algorithm used (see section Examples).
Model wrappers
CroptimizR has been designed to be generic, that is to be used with any crop model for which an R wrapper can be provided.
An R wrapper is basically an R function able to run model simulations
for prescribed values of some of its input parameters and to return the
values of its simulated outputs. This wrapper must have a specific
interface, i.e. a given list and shape of input arguments and returned
values. Detailed guidelines on how to implement a crop model wrapper as
well as different examples of wrappers are provided in the vignette Guidelines
for implementing a crop model R wrapper for CroptimizR. A generic
function for testing that model wrappers behave as expected and return
values in an adequate form is provided in the package (see
test_wrapper function).
Note that the use of an R wrapper does not imply that the crop model
is implemented in R language. Interfaces between R and many computer
languages exist (see e.g. the reticulate
package for Python, here
for solutions concerning Fortran, here
for solutions concerning C and C++ …). These interfaces allow calling
functions implemented in these languages within R functions. In case the
crop model is available as an executable binary file, a basic solution
for running model simulations from an R wrapper consists in using the
base R function system2 (see ? system2()
within R).
Simulated results provided by crop model wrappers compatible with CroptimizR can be directly used with CroPlotR package functions as illustrated in section Model Evaluation.
Model wrappers for CroptimizR have been developed for more than a dozen of crop models among which STICS (see packages SticsOnR and SticsRFiles), ApsimX (see [https://github.com/APSIMInitiative/ApsimOnR]), DSSAT 4.7 (CERES, CropSim, NWheat), SiriusQuality2, HERMES, CropSyst, SIMPLACE–LINTUL5, MONICA, SSM-Wheat, …
Observations
Observed values of model output variables have to be provided under
the shape of a named list of data frames. For each observed situation
(typically a plot-year-treatment experiment), the corresponding data
frame must include one column named Date with the dates of
the different observations (in Date or POSIXct
format) and one column per observed variables, with either the measured
values or NA if the variable is not observed at the given date.
Let’s consider the observations are, as often, available under the shape of a text file as displayed in Figure 2.
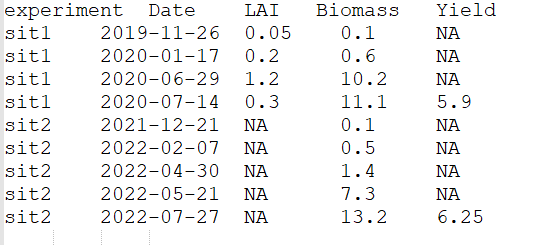
Figure 2: Example of a text file defining observations.
In this example, observations are available for two situations,
called here sit1 and sit2, three variables for
situation sit1 (LAI, Biomass and
Yield) and two for sit2 (Biomass
and Yield). Observations of Yield where only
provided for the last date.
The following R code allows reading this file and store the observations in the expected format:
obs_df <- read.table("GettingStarted/obs.csv", header = TRUE)
obs_df$Date <- as.Date(obs_df$Date)
obs_list <- split(obs_df[-1], obs_df$experiment)

print(obs_list)
#> $sit1
#>         Date  LAI Biomass Yield
#> 1 2019-11-26 0.05     0.1    NA
#> 2 2020-01-17 0.20     0.6    NA
#> 3 2020-06-29 1.20    10.2    NA
#> 4 2020-07-14 0.30    11.1   5.9
#>
#> $sit2
#>         Date LAI Biomass Yield
#> 5 2021-12-21  NA     0.1    NA
#> 6 2022-02-07  NA     0.5    NA
#> 7 2022-04-30  NA     1.4    NA
#> 8 2022-05-21  NA     7.3    NA
#> 9 2022-07-27  NA    13.2  6.25
Examples
Several vignettes detail example of use of CroptimizR:
Simple introductory examples of parameter estimation using CroptimizR on complex crop models are provided in vignettes, using the STICS model here and the ApsimX model here
A more complex example, showing simultaneous estimation of specific and varietal plant parameters is available here.
An example demonstrating the application of a parameter selection algorithm can be found here.
An example using the DREAM-zs Bayesian algorithm is detailed here.
An example illustrating the AgMIP calibration workflow is shown here.
See here
for a detailed description of the input and output arguments of the
estim_param function, the core function for parameter
estimation (or type ? estim_param in an R console after
installing and loading the CroptimizR package). See also the
run_protocol_agmip function for applying the AgMIP
calibration workflow in a streamlined way.
Model evaluation
Model results are classically evaluated by comparison to corresponding observations using graphs and statistical criteria. We designed a specific package for this task: CroPlotR.
CroPlotR use the same data format for observations and simulations than CroptimizR: the results returned by model wrappers and the observation lists adapted to CroptimizR are thus directly compatible with CroPlotR.
References
Confalonieri, R., Orlando, F., Paleari, L., Stella, T., Gilardelli, C., Movedi, E., Pagani, V., Cappelli, G., Vertemara, A., Alberti, L., Alberti, P., Atanassiu, S., Bonaiti, M., Cappelletti, G., Ceruti, M., Confalonieri, A., Corgatelli, G., Corti, P., Dell’Oro, M., Ghidoni, A., Lamarta, A., Maghini, A., Mambretti, M., Manchia, A., Massoni, G., Mutti, P., Pariani, S., Pasini, D., Pesenti, A., Pizzamiglio, G., Ravasio, A., Rea, A., Santorsola, D., Serafini, G., Slavazza, M., Acutis, M., 2016. Uncertainty in crop model predictions: What is the role of users? Environ. Model. Softw. 81, 165–173. https://doi.org/10.1016/J.ENVSOFT.2016.04.009
Guillaume, S., Bergez, J.E., Wallach, D., Justes, E., 2011. Methodological comparison of calibration procedures for durum wheat parameters in the STICS model. Eur. J. Agron. 35, 115–126. https://doi.org/10.1016/J.EJA.2011.05.003
He, D., Wang, E., Wang, J., Robertson, M.J., 2017. Data requirement for effective calibration of process-based crop models. Agric. For. Meteorol. 234–235, 136–148. https://doi.org/10.1016/J.AGRFORMET.2016.12.015
Wallach, D., Palosuo, T., Thorburn, P., Gourdain, E., Asseng, S., Basso, B., Buis, S., Crout, N., Dibari, C., Dumont, B., Ferrise, R., Gaiser, T., Garcia, C., Gayler, S., Ghahramani, A., Hochman, Z., Hoek, S., Hoogenboom, G., Horan, H., Huang, M., Jabloun, M., Jing, Q., Justes, E., Kersebaum, K.C., Klosterhalfen, A., Launay, M., Luo, Q., Maestrini, B., Mielenz, H., Moriondo, M., Nariman Zadeh, H., Olesen, J.E., Poyda, A., Priesack, E., Pullens, J.W.M., Qian, B., Schütze, N., Shelia, V., Souissi, A., Specka, X., Srivastava, A.K., Stella, T., Streck, T., Trombi, G., Wallor, E., Wang, J., Weber, T.K.D., Weihermüller, L., de Wit, A., Wöhling, T., Xiao, L., Zhao, C., Zhu, Y., Seidel, S.J., 2021a. How well do crop modeling groups predict wheat phenology, given calibration data from the target population? Eur. J. Agron. 124, 126195. https://doi.org/10.1016/J.EJA.2020.126195
Wallach, D., Palosuo, T., Thorburn, P., Hochman, Z., Andrianasolo, F., Asseng, S., Basso, B., Buis, S., Crout, N., Dumont, B., Ferrise, R., Gaiser, T., Gayler, S., Hiremath, S., Hoek, S., Horan, H., Hoogenboom, G., Huang, M., Jabloun, M., Jansson, P.E., Jing, Q., Justes, E., Kersebaum, K.C., Launay, M., Lewan, E., Luo, Q., Maestrini, B., Moriondo, M., Olesen, J.E., Padovan, G., Poyda, A., Priesack, E., Pullens, J.W.M., Qian, B., Schütze, N., Shelia, V., Souissi, A., Specka, X., Kumar Srivastava, A., Stella, T., Streck, T., Trombi, G., Wallor, E., Wang, J., Weber, T.K.D., Weihermüller, L., de Wit, A., Wöhling, T., Xiao, L., Zhao, C., Zhu, Y., Seidel, S.J., 2021b. Multi-model evaluation of phenology prediction for wheat in Australia. Agric. For. Meteorol. 298–299, 108289. https://doi.org/10.1016/J.AGRFORMET.2020.108289
Wallach, D., Palosuo, T., Thorburn, P., Mielenz, H., Buis, S., Hochman, Z., Gourdain, E., Andrianasolo, F., Dumont, B., Ferrise, R., Gaiser, T., Garcia, C., Gayler, S., Hiremath, S., Horan, H., Hoogenboom, G., Jansson, P.-E., Jing, Q., Justes, E., Kersebaum, K.-C., Launay, M., Lewan, E., Mequanint, F., Moriondo, M., Nendel, C., Padovan, G., Qian, B., Schütze, N., Seserman, D.-M., Shelia, V., Souissi, A., Specka, X., Srivastava, A.K., Trombi, G., Weber, T.K.D., Weihermüller, L., Wöhling, T., Seidel, S.J., 2023. Proposal and extensive test of a calibration protocol for crop phenology models. https://link.springer.com/article/10.1007/s13593-023-00900-0
Wallach D., Buis S., Seserman D.M., Palosuo T., Thorburn P., Mielenz H., Justes E., Kersebaum K.C., Dumont B., Launay M., Seidel S.J. 2024. A calibration protocol for soil-crop models. Environmental Modelling & Software, 180, 106147. https://doi.org/10.1016/j.envsoft.2024.106147
Wallach, D., Kim, K. S., Hyun, S., Buis, S., Thorburn, P., Mielenz, H., Seidel, S., Alderman, P., Dumont, B., Fallah, M.H., Hoogenboom, G., Justes, E., KErsebaum, K.-C., Launay, M., Leolini, L., Mehmood, M.Z., Moriondo, M., Jing Q., Qian, B., Schultz, S., Palosuo, T. 2025. Evaluating the AgMIP calibration protocol for crop models; case study and new diagnostic tests. European Journal of Agronomy, 168: 127659. https://doi.org/10.1016/j.eja.2025.127659